Contents |
To study your memory and sleep, use options available in SuperMemo in the following places:
Examples
Tools : Workload
You can use Tools : Workload (Ctrl+W) to inspect the daily and the monthly calendar of repetitions. You can view the number of repetitions scheduled, number of scheduled topics, number of scheduled items, as well as the record of past repetitions, and past retention, or how many new items were memorized.
Daily workload

Monthly workload

Tools : Statistics : Analysis
You can use Tools : Statistics : Analysis (Shift+Alt+A) to inspect your forgetting curve, daily changes to your measured forgetting index, your learning overload, and many more:
Forgetting curve

Daily changes to the measured forgetting index

Priorities missed due to overload

Tools : Statistics : Statistics
You can use Tools : Statistics : Statistics to supervise and understand your learning process:

Tools : Statistics : Element data
You can use Tools : Statistics : Element data to inspect learning statistics of a given element:

You can use Learning : Show repetition history (Shift+Ctrl+H) (on the element menu) to inspect the history of repetitions for individual elements:

Repetitions graph
Repetitions graph for any subsets of elements can be shown in the browser with Tools : Repetitions graph on the browser menu:
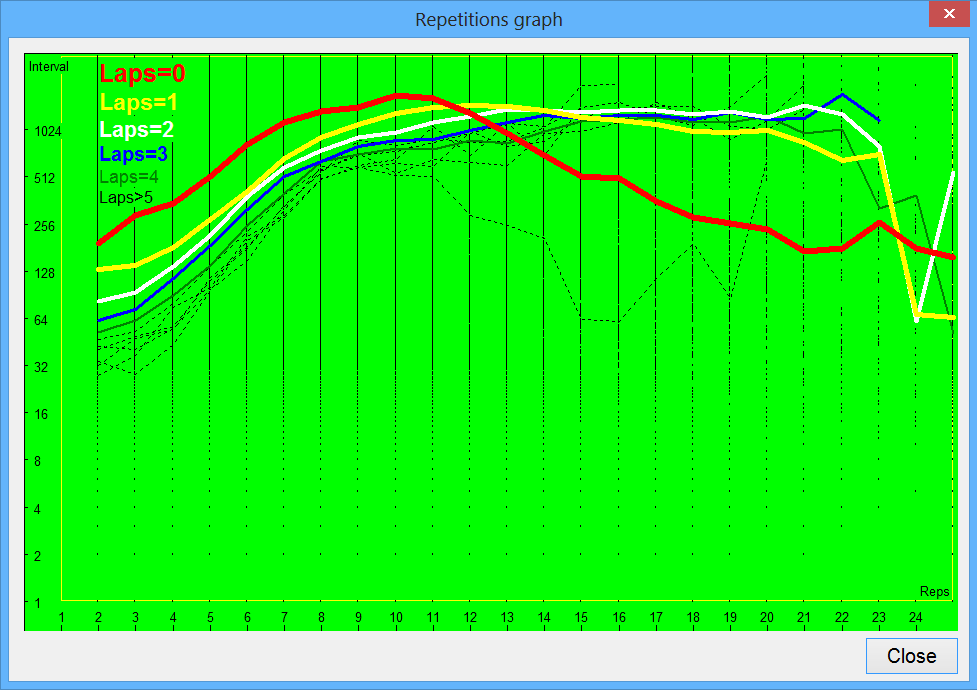
Figure: The horizontal axis corresponds with the repetition number and the vertical axis represents intervals (logarithmic scale). Despite a popular belief, the semi-log scale does not produce a linear graph here. Clearly the increase in the length of intervals slows down with successive repetitions. Moreover, the graph corresponding with zero lapses (red curve), results from the superposition of items with lower and faster increase in intervals (determined by difficulty). The bell-shaped curve is determined by all contributing items (below repetition number 10) and then only by difficult items or items with low forgetting index for which the increase in the length of intervals is significantly slower (above repetition 10). To see the above graph in your own collection, use Tools : Repetitions graph on the browser menu
Tools : Sleep Chart
You can use Tools : Sleep Chart (F12) to optimize the timing of your sleep as well as the timing of your learning:
Sleep and repetitions timeline
Inspect the timeline of repetitions and sleep:

Look for the best time for learning or sleep (see Sleep Chart for details):

Alertness
See how your brain gradually loses its power during the day:

Two-component sleep model
Look for the time of the day that should give you maximum learning power (Shift+click a day in the sleep timeline). See when your learning is not likely to be effective and when you should rather go to sleep:
