| Analysis of the learning
process |
The tabbed dialog available with Tools
: Statistics : Analysis in SuperMemo provides graphs and tables that illustrate the
current state of the learning process in the currently opened collection.
The following tabs are available in the Analysis dialog box:
Distributions
Interval distribution - distribution of
inter-repetition intervals in a given collection. By changing the setting of
the combo box at the bottom of the dialog, you can see interval
distributions for topics, items and for all elements in the collection
A-Factor distribution - distribution of A-Factors in a given collection.
The distribution
itself is not used in Algorithm SM-11, and merely results from
it. Note that topics and items use different A-Factor
categories. Choose Items only or Topics only at the bottom to see distributions for items or topics. If you choose, All elements,
you will see a less meaningful conglomerate distribution indexed by A-Factor
category number

Repetitions distribution - distribution of the
number of repetitions of items or topics in a given collection (only memorized
elements are considered in the distribution, i.e. there is no zero-repetitions category)
Lapses distribution - distribution of the number of
times particular elements in the collection have been forgotten (only memorized elements are considered).
As topics are never 'forgotten', there are no lapses listed in Lapses
distribution if you select Topics
only in the element type combo box
Forgetting Curves -
400 forgetting curves are independently plotted in order to compute the RF
matrix in Algorithm SM-11. These
correspond to twenty repetition number categories multiplied by twenty A-Factor categories (note that for
data representation convenience, the
columns of the RF matrix for the first repetition are indexed by the number of memory lapses
rather than A-Factor). By choosing a proper combination of tabs at the bottom of the graph,
you can select a forgetting curve of interest. Horizontal axis represents time expressed
as: (1) U-Factor, i.e. the ratio of subsequent inter-repetition intervals, or (2) days
(only for the first repetition). Vertical axis represents knowledge retention
in percent.

Blue circles in the picture represent data collected during repetitions. The greater the circle, the greater the number of
repetitions recorded. The red curve corresponds with the best-fit forgetting curve obtained by
exponential regression (note that for ill-structured material the forgetting
curve is crooked, i.e. not exactly exponential). The horizontal green line corresponds with the requested
forgetting index, while the vertical green line shows the moment in time in which the
approximated forgetting curve intersects with the requested forgetting index line. This
moment in time determines the value of the relevant R-Factor, and indirectly,
the value of the optimum interval (for the first repetition, R-Factor corresponds
with the first optimum interval). The values of O-Factor and
R-Factor are displayed at the top of the graph. They are followed by the number of
repetition cases used to plot the graph. At the beginning of the learning process, there is no repetition history and no
repetition data to compute R-Factors. It will take some time before your first
forgetting curves are plotted. For that reason, the initial
value of the RF matrix is taken from the model of a less-than-average student.
The model of
average student is not used because the convergence from poorer student parameters upwards
is faster than the convergence in the opposite direction.
3-D Curves
These graphs show the forgetting curves in 3 dimensions. Each graph
corresponds with a different A-Factor (from 1.2 to 6.9). The X axis represents
time (as in Forgetting curves). The Y
axis represents repetition category. The vertical Z axis represents retention in
percent. For better visibility, you can rotate 3-D forgetting curves with Rotate,
or smooth them with Smooth. Note that smoothing proceeds along the
Y axis. This makes it possible to align incompletely plotted forgetting curves
from different repetition categories. However, once you click Rotate, Y
axis smoothing will produce a different result. For the best illustration of the
forgetting process, smooth the graph before you rotate it.
Graphs
Forgetting Index vs. Priority graph - this graph
shows you how forgetting depends on the priority of the learning material.
If you always go through your outstanding material in time and if you stick
to the 20 rules of knowledge formulation,
your measured forgetting index
should be the same as the requested
forgetting index. This graph will then show a flat straight line passing
horizontally at the level of the forgetting index. However, once you start
overloading the learning process and using Postpone
or Mercy, your measured forgetting
index will increase. If you always sort your repetitions by priority (e.g.
by leaving Learn : Sorting : Auto-sort repetitions checked), you
should still ensure that your measured forgetting index equals the requested
forgetting index for high priority elements (i.e. on the left side of the
graph). Your measured forgetting index for low priority material will be
higher, and the greater the overload the greater the difference. If you
change your repetition sorting criteria by increasing randomization of
repetitions, this graph will be flatter and the measured forgetting index
for high priority material will be higher
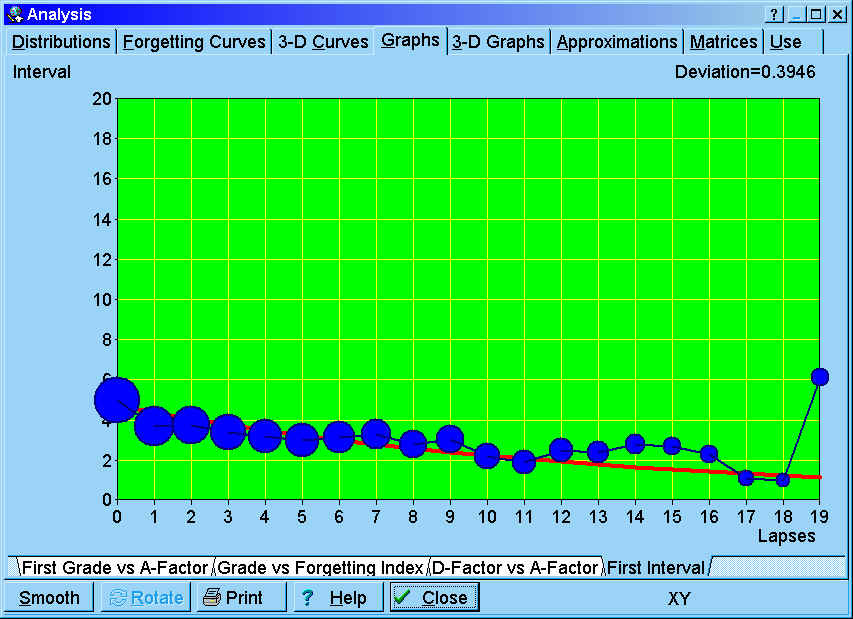
First interval graph - the length of the first
interval after the first repetition depends on the number of times a given item has been
forgotten. Note that the first repetition here means the first repetition after
forgetting (i.e. not the first repetition ever). In other words, a twice repeated item will have the repetition number equal to
one after it has been forgotten (i.e. the repetition number will not equal three). The
first interval graph shows exponential regression curve that approximates the length of
the first interval for different numbers of memory lapses
(including the zero-lapses category that corresponds with newly memorized
items). In the graph below, blue circles correspond to data collected in the
learning process (the greater the circle, the more repetitions have been
recorded). In the presented case, newly memorized items are optimally
repeated after seven days; however, items that have been forgotten 10 times
(which is rare in SuperMemo) will require the interval of two days (due to
logarithmic scaling, the size of the circle is not linearly proportional to
the data sample and the number of repetition cases for lapses=0 is by far
larger than for lapses=10 as can be seen in Distributions : Lapses distribution).
The graph below includes data from over 130,000 repetitions
D-Factor vs. A-Factor graph - DF-AF graph shows decay constants of
power approximation of R-Factors along columns of the RF matrix. You need to
understand SuperMemo Algorithm to
understand this graph. The horizontal axis
represents A-Factor, while the vertical axis represents
D-Factor (i.e. Decay Factor). D-Factor is a decay constant of power approximation of
curves that can be inspected with the Approximations tab of the Analysis dialog
box
First Grade vs. A-Factor graph - G-AF graph correlates the first grade
obtained by an item with the ultimate estimation of its A-Factor
value. At each repetition, the current element's old A-Factor estimation is removed from
the graph and the new estimation is added. This graph is used by the SuperMemo
Algorithm to quickly estimate the first value of
A-Factor at the moment when all we know about an element is the first grade it has scored
in its first repetition
Grade vs. Forgetting Index graph - FI-G graph correlates the expected forgetting index with the grade
scored at repetitions. You need to understand SuperMemo
Algorithm to understand this graph. You can
imagine that the forgetting curve graph might use the average grade instead of
the retention on its vertical axis. If you correlated this grade
with the forgetting index, you would arrive at the FI-G graph.
This graph is used to compute the estimated forgetting index that in turn is
used to normalize grades (for delayed or advanced repetitions) and estimate
the new value of item's A-Factor. The grade is computed using the formula: Grade=Exp(A*FI+B),
where A and B are parameters of exponential regression run over raw data
collected during repetitions

3-D Graphs
3-D graphs that visually represent OF, RF and Cases matrices
(see: Matrices)
Approximations
Twenty power approximation curves
that show the decline of R-Factors along columns of the RF matrix. You need to
understand SuperMemo Algorithm to
understand these graphs. For each A-Factor, with increasing values of the repetition number, the
value of R-Factor decreases (at least theoretically it should decrease). Power regression
is used to illustrate the degree of this decline that is best reflected by the decay
constant called here D-Factor. By choosing the A-Factor tab at the bottom of the graph,
you can view a corresponding R-Factor approximation curve. The horizontal axis represents
the repetition number category, while the vertical axis represents R-Factor. The value of D-Factor
is shown at the top of the graph. The blue polyline shows R-Factors as derived from
repetition data. The red curve shows the fixed-point power approximation of R-Factor
(fixed-point approach is used as for the repetition number equal two, R-Factor equals
A-Factor). The green curve shows the fixed-point power approximation of R-Factor
derived from the OF matrix. This is equivalent to substituting the D-Factor obtained by
fixed-point power approximation of R-Factors with D-Factor obtained from DF-AF linear
regression
Matrices - you
need to understand SuperMemo Algorithm to
understand these tables.
O-Factor matrix - matrix of optimal factors indexed
by the repetition number and A-Factor (only for the first
repetition, A-Factor is replaced with memory lapses)
R-Factor matrix - matrix of retention factors
Cases matrix - matrix of repetition cases used to
compute the corresponding entries of the RF matrix (double click an entry to view the
relevant forgetting curve). This matrix can be edited manually (e.g. if you
want to change the weight of some measurements during repetitions)
Optimal intervals - matrix of optimum intervals
derived from the OF matrix
D-Factor vector - vector of D-Factor values for
different A-Factor values (also repetition cases used in
computing particular D-Factors)
Use
Graphs of changes in the statistics of the learning process over time. These graph
record daily changes to statistics such as the number of memorized items,
measured forgetting index or the number of outstanding items for a given day.
The first non-zero value of the day is recorded. If that value increases
afterwards, that increase is ignored (except a few cases such as the statistic
of newly memorized items, etc.). If you have a break in learning, the last
recorded non-zero value will propagate through the period in which you did not
use SuperMemo (except a few cases such as the statistics of repetitions made,
etc.).
To zoom in on a portion of the graph (as in pictures below), sweep the
portions of the graphs that are to be removed with the mouse (e.g. point the day
of focus, move the mouse left and release the mouse button). You can also use Ctrl+Left
and Ctrl+Right buttons to zoom in.
Here are the
statistics recorded daily by SuperMemo and displayed on the Use tab:
- Work done
- Use time - your daily total time in which you actively used a
given collection (as recorded in Tools :
Timeline)
- Recall time - your daily total time which you spent on trying
to recall answer to questions
- Repetitions - your daily recorded number of item and topic
reviews
- Item repetitions - your daily record of item repetitions
- Topic repetitions - your daily record of topic reviews
- Outstanding - number of outstanding elements scheduled for a
given day
- Outstanding - number of all outstanding elements scheduled for a
given day
- Outstanding items - number of outstanding items scheduled for a
given day
- Outstanding topics - number of outstanding topics scheduled for a
given day
- Burden
- Burden - current Burden
parameter record. Burden estimates the number of elements scheduled for
repetition daily on the assumption of no delays in the learning process.
Burden is the sum of interval reciprocals. Burden
= Item burden + Topic burden
- Item burden - current Burden for items
- Topic burden - current Burden for topics
- Overload - the number of executed repetitions divided by the number
of outstanding repetitions (i.e. the percent of the actually executed
repetitions)
- Elements - the percent of all outstanding repetitions executed
- Items - the percent of outstanding item repetitions executed
- Topics - the percent of outstanding topic reviews done
- Element count
- Elements - total number of elements in the collection as recorded on
a given day (i.e. topics +
items + tasks)
- Items - number of items in the collection as recorded on
a given day
- Topics and tasks - number of topics and tasks in the collection as recorded on
a given day
- Memorized
- Memorized - number of elements taking part in the learning process
(i.e. not dismissed and not pending)
- Memorized items - number of items taking part in the learning process
- Memorized tasks - number of topics taking part in the learning process
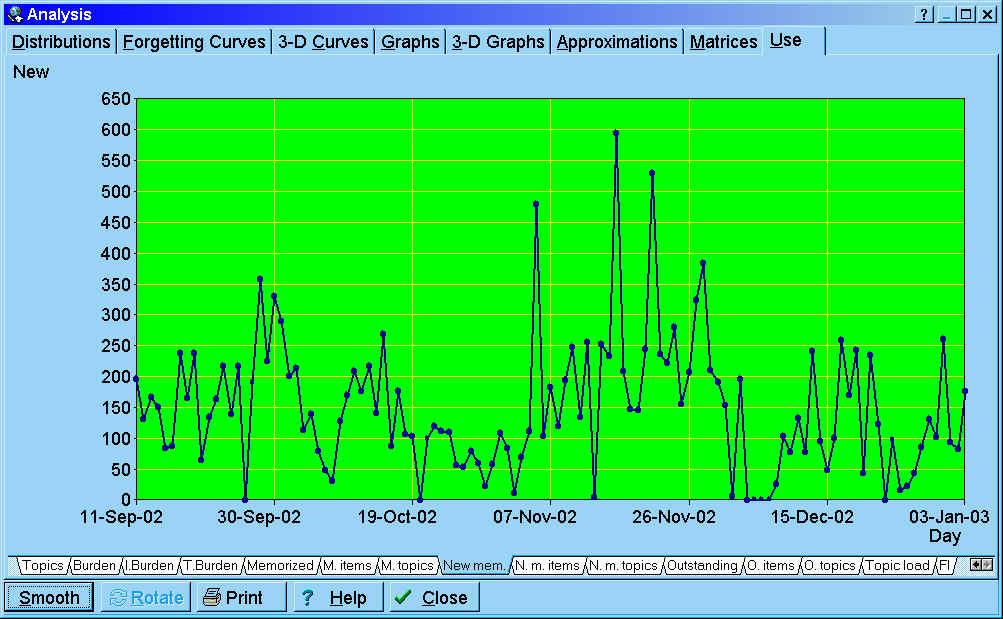
- Newly memorized
- Newly memorized - new elements memorized on a given day
(see an exemplary graph below)
- New items - new items memorized on a given day
- New topics - new topics memorized on a given day
- Efficiency
- Forgetting index - measured forgetting index
- Retention - retention as measured on each day
- Topic load - proportion of topics scheduled for review on a given
day among all elements scheduled
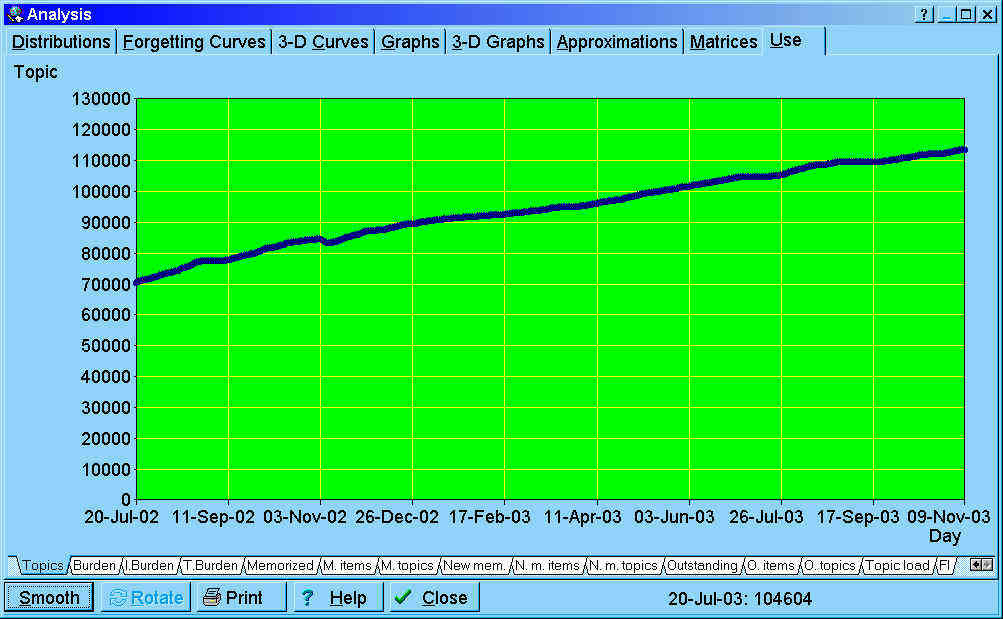
Exemplary graph showing the total number of topics stored in the
collection. The data displayed on the bottom depends on the position of the
mouse. In this example, it indicates that on Jul 20, 2003, there were 104,604
topics in the incremental reading process.
Exemplary graph showing the number of elements memorized on
individual days. By sweeping away the left and right part of the graph, it is
possible to zoom in on a small section of the learning process. The period shown
on the graph spans from Sep 11, 2002 to Jan 3, 2003.
See also: